top of page

WEALTH STRATEGIC FINANCIAL TECHNOLOGY MEANS TRUST, SIMPLICITY AND PERFORMANCE

WEALTH STRATEGIC
RETURNS 2021*
WEALTH STRATEGIC
NASDAQ 100
SP500
RUSSELL 2000
TSX
BARCLAYS HFI
BARCLAYS GMI
+45.02%
+21.40%
+26.90%
+13.81%
+21.74%
+10.22%
+8.79%
* Before financing fees charged by the broker.
WEALTH STRATEGIC
RETURNS 2022*
WEALTH STRATEGIC
NASDAQ 100
SP500
RUSSELL 2000
TSX
BARCLAYS HFI
BARCLAYS GMI
+39.45%
-33.28%
-19.64%
-21.61%
-9.14%
-10.18%
+4.27%
* Before financing fees charged by the broker.
WEALTH STRATEGIC
RETURNS 2023*
WEALTH STRATEGIC
NASDAQ 100
SP500
RUSSELL 2000
TSX
BARCLAYS HFI
BARCLAYS GMI
+10.75%
+53.81%
+24.23%
+15.09%
+8.12%
+9.34%
+5.19%
* Before financing fees charged by the broker.
WEALTH STRATEGIC
RETURNS 2024*
WEALTH STRATEGIC
NASDAQ 100
SP500
RUSSELL 2000
TSX
BARCLAYS HFI
BARCLAYS GMI
+32.22%
+24.88%
+23.31%
+10.02%
+17.99%
+9.68%
+9.20%
* Before financing fees charged by the broker.
WEALTH STRATEGIC
RETURNS 2025 (08/20/25)
WEALTH STRATEGIC
NASDAQ 100
SP500
RUSSELL 2000
TSX
BARCLAYS HFI
BARCLAYS GMI
+20.39%
+10.98%
+8.74%
+2.53%
+13.52%
+6.08%
+4.20%


Growth of $1M portfolio and cumulative returns since inception, 2021-2025
WEALTH STRATEGIC
RISK MEASURES 2025 (08/28/25)
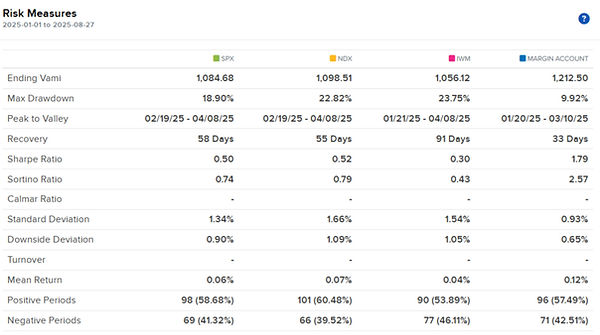
WEALTH STRATEGIC
DISTRIBUTION OF RETURNS BY ASSET CLASS in %*
Year | Equities | Commodities | Currencies | Bonds |
|---|---|---|---|---|
2021 | 43.65 | 33.71 | 16.45 | 6.19 |
2022 | -6.82 | 70.91 | 25.53 | 10.38 |
2023 | 49.95 | 20.84 | 24.96 | 4.92 |
2024 | 69.05 | 13.50 | 15.79 | 1.66 |
2025 | 44.23 | 15.25 | 34.41 | 6.11 |
* Closed positions only.
WEALTH STRATEGIC HAS NO CORRELATION WITH
MAJOR BENCHMARKS
NASDAQ 100
SP500
RUSSELL 2000
TSX
BARCLAYS HFI
BARCLAYS GMI
0.00
-0.06
-0.18
-0.05
-0.14
+0.04
* A reading of 1 is directly correlated and -1 is inversely correlated.
YOU CAN NOW BENEFIT FROM THE WEALTH STRATEGIC TECHNOLOGY WITH THE SMIF PROGRAM FOR FAMILY OFFICES.
bottom of page